Flight Profile — Actual vs. Simulation
Flight Data
Barometer
July 2026
The whole flight in one chart, from liftoff to touchdown, laid over what our simulation predicted.
Overview
The full flight from liftoff to touchdown, measured by the onboard barometer, overlaid with our pre-flight OpenRocket prediction. The rocket boosted for about 1 second, coasted for 7.3 more, deployed at 8.3 seconds, topped out at 575 m (1,887 ft) at 9.7 seconds, and rode the chute down for 87 seconds to a soft landing.
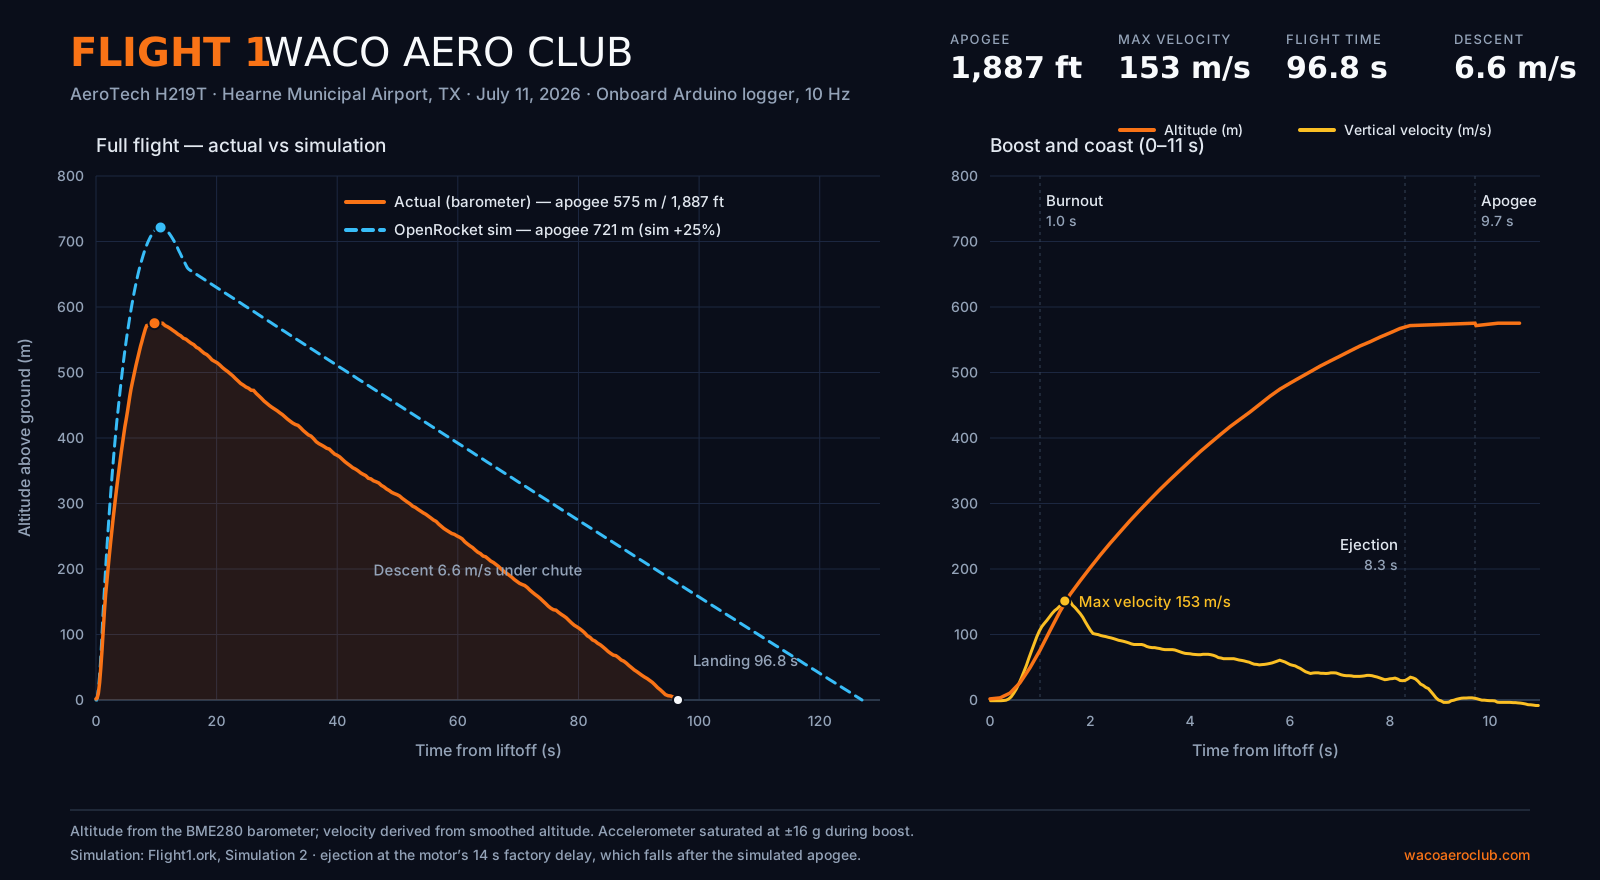
Left: full flight, actual (orange) vs. simulation (dashed blue). Right: boost and coast detail with vertical velocity.
Key Events
| Event | Time | Altitude (AGL) |
|---|
| Liftoff | 0.0 s | 0 m |
| Motor burnout | ~1.0 s | ~76 m |
| Ejection charge | 8.3 s | ~570 m |
| Apogee | 9.7 s | 575 m |
| Landing | 96.8 s | 0 m |
Recovery Check
Average descent rate was 6.6 m/s, holding steady at ~6.8 m/s all the way to the ground — inside the standard 4.5–7 m/s safe window for this weight class. The chute was correctly sized and fully inflated for the entire descent.
Simulation vs. Reality: A 25% Overshoot
Analysis
OpenRocket
July 2026
Our pre-flight prediction came in 25% high. Here's the side-by-side, and what the gap says about drag and weight.
The Numbers
| Metric | OpenRocket Sim | Actual | Difference |
|---|
| Apogee (AGL) | 721 m | 575 m | Sim over by 25% |
| Max velocity | 181 m/s | ~153 m/s | Sim over by ~18% |
| Burn time | 1.08 s | ~1.0 s | Match |
| Time to apogee | 10.7 s | 9.7 s | −1.0 s |
| Descent rate | 5.8 m/s | 6.6 m/s | Sim under by 12% |
Interpretation
The motor performed exactly as expected — burn time matched the sim almost perfectly. Everything else points one direction. The rocket flew slower than predicted, and it also fell faster than predicted. Both of those are what you see when a rocket is heavier than its model.
The descent is the useful one, because it lets us put a number on it. Under an open parachute the airframe's own drag barely matters, so descent rate depends almost entirely on mass. The model predicted 5.8 m/s and we measured 6.6 m/s. Working backwards from the same chute, that means the real rocket weighed roughly 1,330 g at landing against the 1,036 g in the model — about 300 g unaccounted for, close to a quarter of the airframe. Epoxy, paint, launch lugs, wiring, tape and the data logger bay hardware all add up, and none of it was in the model.
So before blaming aerodynamics for the 146 m shortfall, the mass has to go in. Our next step is to weigh the finished rocket, put the missing mass into OpenRocket where it actually sits, and re-run — then see how much of the gap is genuinely drag.
A small part of the gap has a separate, known cause: early parachute deployment, covered in the next section.
Takeaway: Treat OpenRocket apogee predictions for our builds as optimistic until calibrated against flight data. For the next flight we will weigh the finished rocket and tune the sim's drag coefficient until it reproduces this flight — then predictions become trustworthy.
How Early Deployment Cut Our Apogee
Analysis
Recovery
July 2026
The parachute fired 1.4 seconds early. We work out what that cost us in altitude, and why missing early beats missing late.
What Happened
The ejection charge fired at 8.3 seconds — about 7.3 seconds after burnout and 1.4 seconds before the rocket reached its natural peak. At that moment the rocket was still climbing at roughly 25–30 m/s. Deploying the chute killed that remaining upward momentum: the rocket only gained about 6 more meters after ejection instead of coasting to its full ballistic apogee.
What It Cost
A rocket climbing at ~25–30 m/s and decelerating at ~10.5–11.5 m/s² (gravity plus a little drag) had roughly 30–40 m of climb left in it. We banked about 6 m of that. Our best estimate is that early deployment cost roughly 20–30 m (65–100 ft) of apogee — without it, the flight would have peaked somewhere around 595–615 m instead of 575 m. The simulation, run below, lands at the bottom of that range.
| Scenario | Apogee (approx.) |
|---|
| Actual (deployed 1.4 s early) | 575 m / 1,887 ft |
| Estimated ballistic (deploy at peak) | ~595–615 m / ~1,950–2,020 ft |
Uncertainty note: the barometer reading is disturbed for a moment by the ejection charge's pressure pulse, so the deployment velocity carries real uncertainty — that is why we report a range rather than one number.
Splitting the Gap
The estimate above is hand-worked kinematics. We can also let the simulation answer it directly. Below, our OpenRocket model flies twice: once with the chute at the motor's 14-second factory delay, which leaves the rocket free to coast to its full peak, and once with the chute forced open at 8.3 seconds — the moment our charge actually fired. Nothing else changes between the two runs, so the distance between them is the cost of the timing alone, and the distance from there down to the measured flight is everything the model got wrong about the rocket itself.
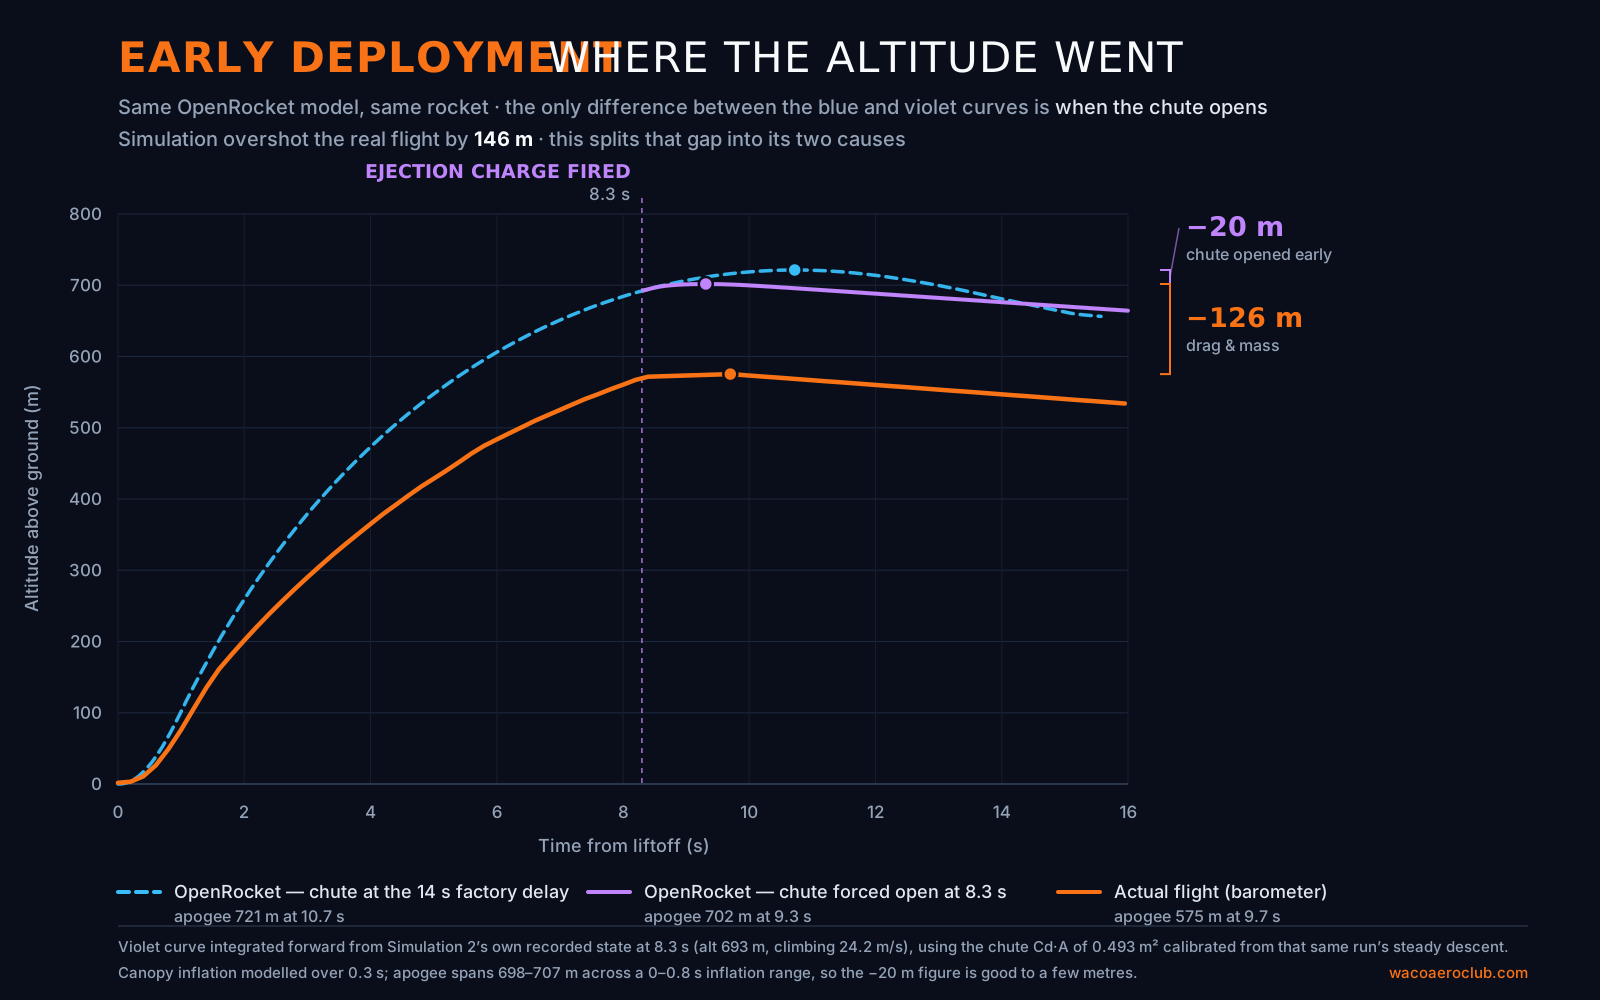
Both simulated runs are the same flight until 8.3 s — the violet curve is drawn only from the moment the chute opens.
Early deployment accounts for about 20 m, only around a seventh of the gap. The other 126 m is drag and unmodelled mass. That is the honest headline of this flight: the timing error is the one everybody notices, and it is by far the smaller problem. Our model of the rocket was wrong by six times more than our delay was.
Why It Fired Early
The motor's factory delay was drilled down to a ~10-second target (OpenRocket's computed optimum was 9.7 s), but the delay actually burned for about 7.3 seconds — roughly 2.7 seconds short. Delay elements have real manufacturing and drilling tolerance, and this flight is our first measured data point on how much.
Perspective: Firing 1.4 s early at ~25–30 m/s is a much better outcome than firing late — a late deployment happens while the rocket is accelerating downward, with higher shock loads on the harness. The chute and harness took the early deployment without damage. This also explains only ~15% of the 146 m gap between simulation and reality — the rest is drag and mass, per the section above.
Spin and Stability
Flight Data
Gyroscope
July 2026
What the gyroscope saw on the way up: a slow, steady roll and a gentle lean into the wind, exactly how a stable rocket should behave.
What the Gyro Showed
| Measurement | Value | Meaning |
|---|
| Roll rate (boost) | ~0.37 rev/s | Gentle fin-induced spin |
| Roll rate (coast) | ~0.48 rev/s | Steady, consistent spin |
| Pitch/yaw rates (coast) | ~24 dps RMS | Small oscillations, no coning |
| Max tilt from vertical | ~17° | Modest weathercocking into the wind |
Interpretation
The flight was clean and stable. A slow half-revolution-per-second roll is normal — tiny asymmetries in fin alignment induce it, and the spin actually helps by averaging those same asymmetries out. Pitch and yaw stayed small through the whole ascent, and the modest lean into the wind is expected behavior for a stable rocket. Tilt values come from integrating the gyro, so treat them as good estimates rather than exact measurements.
3D Ascent Reconstruction
Flight Data
July 2026
Watch the ascent replay in 3D, rebuilt from two onboard sensors and nothing else. Drag to see it from any angle.
What This Is
A 3D reconstruction of the ascent, built entirely from the onboard data: altitude from the barometer, and the rocket's tilt from integrating the gyroscope (a technique called dead reckoning). Because a stable rocket flies where it points, the tilt history reveals the lateral path. Drag to orbit and scroll to zoom. The gray line on the ground is the path's shadow.
Drag to orbit · scroll or pinch to zoom
T+0.0 s · 0 m AGL
Boost
Coast
Apogee
Accuracy & Limits
- Vertical axis: directly measured by the barometer — high confidence.
- Lateral path: estimated from gyro integration at 10 Hz — the shape is roughly right, but treat the ~76 m lateral drift as ±50%, and the compass direction is arbitrary.
- Ascent only: the ejection event spins the rocket faster than 10 Hz sampling can track, so orientation knowledge ends at deployment. The descent drift was not measurable with this logger.
Instrumentation: What Worked, What Didn't
Avionics
Lessons Learned
July 2026
An honest scorecard of the electronics, from the barometer that carried the whole flight to the accelerometer that ran out of range.
Scorecard
| Sensor | Status | Notes |
|---|
| BME280 barometer | Worked | Clean altitude data for the entire flight — the backbone of every chart on this page |
| Gyroscope | Worked | Captured roll and tilt through ascent; 10 Hz is too slow to track the ejection tumble |
| Accelerometer | Partial | Saturated at its ±16g limit during boost — true peak acceleration was never recorded |
What We'd Change
- Wider accelerometer range: configure ±32g or higher (or add a high-g sensor) so boost acceleration isn't clipped.
- Faster logging: 10 Hz was enough for altitude but under-samples fast events like ejection; 50–100 Hz is the goal for the next logger revision.
- Position tracking: the rocket's drift direction is unmeasurable with the current logger — the planned Eggfinder GPS tracker project adds real position data for future flights.